Power BI
Essentials
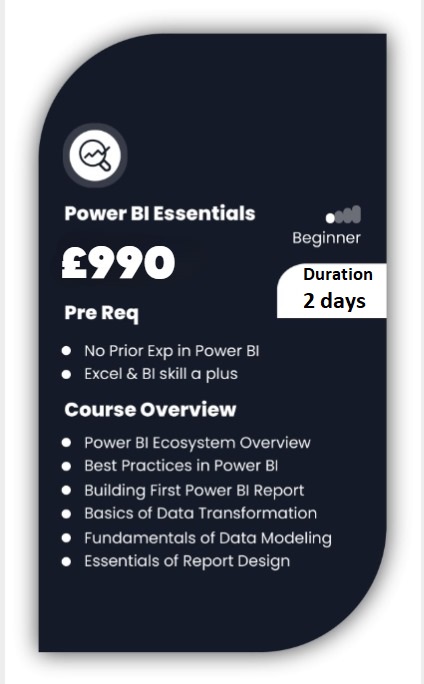
The Power BI Essentials course provides a thorough introduction to Microsoft Power BI, emphasising practical skills through hands-on work with Excel spreadsheets. Participants will become familiar with the key products and features of Power BI, essential for creating effective Business Intelligence solutions.
About this Power BI Course:
Power BI Essentials is a beginner-friendly Power BI course which offers a complete, in-depth introduction to the Microsoft Power BI tool by providing hands-on experience using Excel spreadsheets. During this course, users will be introduced to Power BI products and features essential to develop a BI solution.
This Power BI course also bridges the gap between Excel and Power BI and lays the foundation for advanced courses. We offer this course both in online and in-person formats.
Prerequisites:
The course is suitable for people having a basic experience in Excel. Prior knowledge of Power BI or any other reporting tool is not required. However, familiarisation with business terminologies such as revenue and profit is a plus.
Who should take this Power BI course?
This is a basic Power BI course and is suitable for Excel users who want to develop a fully interactive and visually appealing BI solution. It is also suitable for SQL (or similar database) users who want to enhance their reporting by using state-of-the-art BI tools.
WHY POWER BI TRAINING BY AMZ?
TRUSTED BY TOP COMPANIES
We’re proud to have trained employees from some of the most renowned companies in
the UK. Here’s a glimpse of companies we have had the honour to train:


Upcoming Dates
July
| Date | Day | Training Mode | ||
|---|---|---|---|---|
| 01/07/24 | Mon | Online/Classroom | ||
| 08/07/24 | Mon | Online/Classroom | ||
| 15/07/24 | Mon | Online/Classroom | ||
| 22/07/24 | Mon | Online/Classroom | ||
| 29/07/24 | Mon | Online/Classroom | ||
| Please contact us for further dates | ||||
August
| Date | Day | Training Mode | ||
|---|---|---|---|---|
| 05/08/24 | Mon | Online/Classroom | ||
| 12/08/24 | Mon | Online/Classroom | ||
| 19/08/24 | Mon | Online/Classroom | ||
| 21/08/24 | Wed | Online Live | ||
| 26/08/24 | Mon | Online/Classroom | ||
| Please contact us for further dates | ||||
September
| Date | Day | Training Mode | ||
|---|---|---|---|---|
| 02/09/24 | Mon | Online/Classroom | ||
| 09/09/24 | Mon | Online/Classroom | ||
| 16/09/24 | Mon | Online/Classroom | ||
| 23/09/24 | Mon | Online/Classroom | ||
| 30/09/24 | Mon | Online/Classroom | ||
| Please contact us for further dates | ||||
October
| Date | Day | Training Mode | ||
|---|---|---|---|---|
| 07.10.24 | Mon | Online/Classroom | ||
| 14.10.24 | Mon | Online/Classroom | ||
| 21.10.24 | Mon | Online/Classroom | ||
| 23.10.24 | Wed | Online/Classroom | ||
| 28.10.24 | Mon | Online/Classroom | ||
| Please contact us for further dates | ||||
November
| Date | Day | Training Mode | ||
|---|---|---|---|---|
| 04.11.24 | Mon | Online/Classroom | ||
| 11.11.24 | Mon | Online/Classroom | ||
| 18.11.24 | Mon | Online/Classroom | ||
| 20.11.24 | Wed | Online/Classroom | ||
| 25.11.24 | Mon | Online/Classroom | ||
| Please contact us for further dates | ||||
December
| Date | Day | Training Mode | ||
|---|---|---|---|---|
| 02.12.24 | Mon | Online/Classroom | ||
| 03.12.24 | Tue | Online/Classroom | ||
| 09.12.24 | Mon | Online/Classrom | ||
| 10.12.24 | Tue | Online/Classroom | ||
| 16.12.24 | Mon | Online/Classroom | ||
| Please contact us for further dates | ||||
For more details and to
enrol for a course
Power BI Essentials Course Outline
Unit 1: Understanding Business Intelligence
✅ Why is Data Analytics Important?
✅ Why is the conventional Data Analysis Process inefficient?
✅ What is Business Intelligence?
✅ Steps & concepts involved in Business Intelligence
✅ Other BI Tools in the Market
✅ What is Self-Service BI?
Unit 2: Understanding Power BI
✅ Power BI (Desktop Vs Mobile Vs Service)
✅ Licenses (Free Vs Pro Vs Premium)
✅ What makes Power BI different from other BI Tools?
✅ Frequent Updates and Changes
✅ BI Steps in Power BI
✅ Languages Involved in Power BI (Power Query, DAX, R)
Unit 3: Getting Started With Power BI
✅ Setting up Office 365 Enterprise E3 trial account
✅ Signing up for Power BI
✅ Upgrading to Power BI PRO
✅ Downloading Power BI Desktop
Unit 4: Getting Data in Power BI Desktop
✅ Understanding Power BI Navigation
✅ Exploring Different Data Sources in Power BI
✅ Getting Data from the Web
✅ Getting Data from Azure SQL Database
✅ Getting Data from Azure SQL Database using SQL statement
✅ Getting Data from Access File
✅ Getting Data from Excel
Unit 5: Data Transformation
✅ Navigating Query Editor
✅ What is Query?
✅ What is Data Transformation?
✅ Removing empty rows
✅ Removing irrelevant Columns
✅ Renaming Columns
✅ Changing Data Types
✅ Duplicating Columns
✅ Splitting Columns
✅ Merging Columns
✅ Correcting Spelling Mistakes
✅ Changing cases
Trimming & Cleaning
Unit 6: Introduction to Power Query (M Formula Language)
✅ Exploring Applied Steps
✅ Introducing the idea of repeatable workflows
✅ Updating Applied Steps
✅ Deleting Applied Steps
✅ Renaming Applied Steps
✅ Understanding the Code behind every step
✅ Automating Data Transformation process via repeatable workflows
✅ Exploring Advanced Editor
✅ Loading and Applying Data
Unit 7: Data Modelling
✅ Understand Navigation of Relationship view
✅ What is Data Model?
✅ What is a unique Identifier?
✅ Creating a new relationship
✅ Editing a relationship
✅ Updating a relationship
✅ Understanding Cardinality
✅ Understanding Cross Filter Direction
✅ Why is Data Model more efficient than a Flattened Data Set?
Unit 8: Introduction to DAX
✅ What can we calculate using DAX?
✅ What is Calculated Columns and Calculated Measure?
✅ How is DAX different from Excel Functions?
✅ Calculating a column using DAX
✅ Calculating a measure using DAX
✅ Formatting Data types
✅ Changing property of a Data Type
Unit 9: Data Visualization
✅ Understand Navigation of Report View
✅ Creating a Bar Chart
✅ Formatting a Bar Chart
✅ Changing Chart Type
✅ Creating and Formatting a Column Chart
✅ Creating and Formatting a Line Chart
✅ Creating and Formatting a Pie Chart
✅ Creating and Formatting a Tree Chart
✅ Creating and Formatting a Card
✅ Creating and Formatting a Matrix
✅ Creating and Formatting a Table
✅ Creating and Formatting BubbleMap Visualization
✅ Creating a Filled Map Visualization
Unit 10: Creating Custom Visuals
✅ Getting Custom Visuals from the Store
✅ Creating Sankey Chart
✅ Creating Radar Chart
Unit 11: Visual Interaction
✅ Understanding Visual Interaction
✅ Turning visual interaction on and off
Unit 12: Exploring Filters
✅ Cross Filtering through visuals
✅ Creating a slicer
✅ Visual level filter
✅ Page Level Filter
✅ Report Level Filter
✅ Drill through the filter
✅ Top N Filter
Unit 13: Creating Custom Slicers
✅ Getting Custom Slicer From the Store
✅ Creating Enlighten Word Flag Slicer
✅ Creating Chiclet Slicer
✅ Inserting Images in Chiclet Slicer
Unit 14: Exploring Power BI Desktop Features
✅ Exploring visual options (focus mode, show data, spotlight, export)
✅ Create and Duplicate New Pages
✅ Create images, text boxes, and shapes.
✅ Switch between phone and web layout
✅ Save the report
✅ Print the report
✅ Publish report to Power Bi Service
Unit 15: Power BI service Features
✅ Log in to Power Bi Service
✅ Understand Navigation
✅ Opening and editing your report in the Power BI service
✅ Publishing to the web
✅ Converting report to a PowerPoint
✅ Generating a QR Code
✅ How to get Data directly into Power Bi Service
✅ Importing Data Vs Uploading Data
Unit 16: Dashboard
✅ Pin visuals from the report to the dashboard
✅ Difference between report and dashboard
✅ Why visual interaction isn’t supported in Dashboards
✅ Resizing and moving a visual
✅ Creating a video tile
✅ Creating an image tile
✅ Applying alert on the Card
✅ Pinning complete report to Dashboard
✅ Customizing dashboard for mobile view
✅ Sharing dashboard with colleagues
✅ Viewing Shared Reports
Unit 17: Natural Language Query
✅ What is NLQ and why is it a breakthrough?
✅ Create a Card using NLQ.
✅ Create a Table Using NLQ
✅ Create Bar Visual Using NLQ
✅ Pin the visuals directly to your dashboard.
Unit 18: Power BI publisher for excel
✅ Installing the Add-in
✅ Activating this Add-in in Excel
✅ Connect your Excel Workbook with Power BI
✅ Pin a chart from Excel to Power BI Dashboard
✅ Pin a pivot table from Excel to Power BI Dashboard
✅ Update the Chart in Power BI Dashboard from Excel
Unit 19: Quick Insights
✅ What is the Quick Insight Tool?
✅ How to create quick insights into a dataset
✅ Explore visuals created by this option.
✅ Pin a visual to the dashboard.
Unit 20: Sample Reports and Dashboard
✅ Getting the Sample reports and Dashboard
✅ How samples are very helpful?
✅ Editing sample reports and dashboard
Unit 21: Power BI mobile
✅ Downloading the power bi mobile app and logging in
✅ Understand Navigation
✅ How to see underlying reports
✅ Annotate visuals and share using other apps.
✅ How to see our dashboard
✅ How to see the dashboard shared with us
✅ See report using QR scanner.
✅ Exploring mobile sample reports
#1 Choice For Power BI Training