Power BI
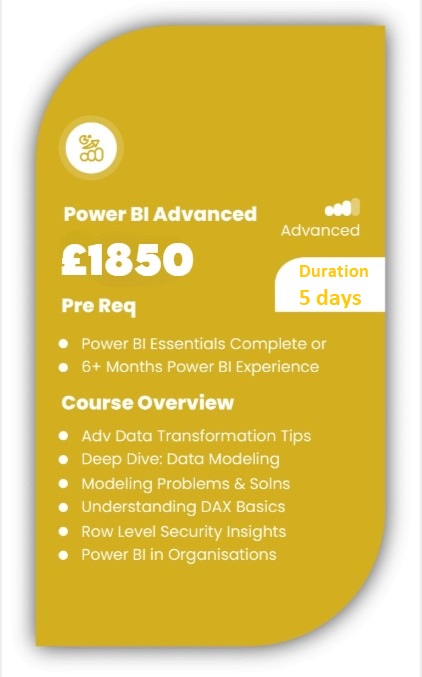
Advanced
Power BI Advanced course provides an in-depth exploration of the latest Power BI features, including fuzzy matching, AI visuals, and Row Level Security. It offers a comprehensive guide through the entire BI process, from the fundamentals of data modeling and cleaning to advanced techniques in data manipulation and wrangling.
You’ll leave this course with a deep understanding of advanced Power BI functionalities and be fully equipped to apply sophisticated data analysis and visualisation techniques in your professional work. Get a Power BI certification at the end of every course!
About this Power BI Course:
This course helps business users to meet their work challenges by introducing them to the latest features such as fuzzy matching, AI visuals, and Row Level Security. This course is a complete walk-through of the BI process from data modeling, data cleaning, data manipulation, and data mugging to data visualization using AI-enhanced visuals and infographics. This course also introduces you to DAX and helps you build a sound foundation of DAX in Power BI based on your Excel/SQL knowledge. With a Power BI certification, you can propel your career ladder and stay relevant in the ever-evolving business landscape.
Prerequisites:
This course is suitable for users who are familiar with the Power BI tool. The users are expected to have completed the Power BI essentials course or have equivalent skills. An experience in Excel with Basic VLOOKUP and Pivot table is a plus.
Who should take this Power BI course?
This course is suitable for users who want to learn how to implement Business Intelligence solutions using top-notch modeling and visualization techniques. This course is also a perfect choice for users who have developed SQL reports and are looking for ways to develop visually appealing and best-performing dashboards.
WHY POWER BI TRAINING BY AMZ?
TRUSTED BY TOP COMPANIES
We’re proud to have trained employees from some of the most renowned companies in
the UK. Here’s a glimpse of companies we have had the honour to train:


Upcoming Dates
July
| Date | Day | Training Mode | ||
|---|---|---|---|---|
| 01/07/24 | Mon | Online/Classroom | ||
| 08/07/24 | Mon | Online/Classroom | ||
| 15/07/24 | Mon | Online/Classroom | ||
| 22/07/24 | Mon | Online/Classroom | ||
| 29/07/24 | Mon | Online/Classroom | ||
| Please contact us for further dates | ||||
August
| Date | Day | Training Mode | ||
|---|---|---|---|---|
| 05/08/24 | Mon | Online/Classroom | ||
| 12/08/24 | Mon | Online/Classroom | ||
| 19/08/24 | Mon | Online/Classroom | ||
| 21/08/24 | Wed | Online Live | ||
| 26/08/24 | Mon | Online/Classroom | ||
| Please contact us for further dates | ||||
September
| Date | Day | Training Mode | ||
|---|---|---|---|---|
| 02/09/24 | Mon | Online/Classroom | ||
| 09/09/24 | Mon | Online/Classroom | ||
| 16/09/24 | Mon | Online/Classroom | ||
| 23/09/24 | Mon | Online/Classroom | ||
| 30/09/24 | Mon | Online/Classroom | ||
| Please contact us for further dates | ||||
October
| Date | Day | Training Mode | ||
|---|---|---|---|---|
| 07.10.24 | Mon | Online/Classroom | ||
| 14.10.24 | Mon | Online/Classroom | ||
| 21.10.24 | Mon | Online/Classroom | ||
| 23.10.24 | Wed | Online/Classroom | ||
| 28.10.24 | Mon | Online/Classroom | ||
| Please contact us for further dates | ||||
November
| Date | Day | Training Mode | ||
|---|---|---|---|---|
| 04.11.24 | Mon | Online/Classroom | ||
| 11.11.24 | Mon | Online/Classroom | ||
| 18.11.24 | Mon | Online/Classroom | ||
| 20.11.24 | Wed | Online/Classroom | ||
| 25.11.24 | Mon | Online/Classroom | ||
| Please contact us for further dates | ||||
December
| Date | Day | Training Mode | ||
|---|---|---|---|---|
| 02.12.24 | Mon | Online/Classroom | ||
| 03.12.24 | Tue | Online/Classroom | ||
| 09.12.24 | Mon | Online/Classrom | ||
| 10.12.24 | Tue | Online/Classroom | ||
| 16.12.24 | Mon | Online/Classroom | ||
| Please contact us for further dates | ||||
For more date options and to
complete the booking
Course Outline
Unit 1 : Introduction
✅ Overview of BI Process
✅ Overview of Different Power BI Products
✅ Latest Features and Top Enhancements in Power BI
Unit 2: Power Query - Advanced Data Transformation
✅ Data Transformation Principle
✅ Pivot and Unpivot
✅ Merging Queries
✅ Appending Queries
✅ Using Basic Group By functionality
✅ Using Advanced Group by Functionality
✅ Choosing Columns
✅ Duplicating a Query
✅ Referencing a Query
✅ Difference between Duplicate and Reference
✅ Extracting Columns
✅ Formatting Columns
✅ Copying Queries across reports
Unit 3 : Power Query - Creating Columns
✅ Creating Date Columns
✅ Creating Standard Columns
✅ Creating Scientific Columns
✅ Creating Statistical Columns
✅ Creating Information Columns
✅ Creating Index Columns
✅ Creating Conditional Columns
✅ Creating Custom Columns
✅ Creating Columns by Examples
Unit 4 : Fuzzy Match
✅ Using Fuzzy Match to Merge Queries
✅ Changing Similarity Threshold
✅Working with Fuzzy Merge Options
✅ Creating and Using Transformation Table
Unit 5 : Data Profiling
✅ What is Data Profiling and its use case?
✅ Column Distribution
✅ Column Quality
✅ Column Profile
Unit 6: Converting Flat File into a Data Model
✅ Duplicate Queries
✅ Removing Columns
✅ Removing Duplicates
✅ Building Relationships
Unit 7: Data Modelling - Fundamental Concepts
✅ Understanding a Data Model
✅ Understanding a Fact Table
✅ Understanding a Data Table
✅ What Is a Dimension?
✅ Working with Look-Up Table
✅ Understanding Star Schema
✅ Understanding the Snowflake Schema
✅ How does Filter Propagation Work?
✅ Understanding Double Vs Single Cross Filtering Direction
✅ Understanding Active Vs Inactive Relationships
Unit 8 : Data Modelling - Common Issues and Solutions
✅ What Questions To Ask Before Starting?
✅ Good Practices of Data Modelling
✅ Having No Unique Identifier
✅ Relation between Two Different Dimensions
✅ Understanding Loops
✅ Creation of Surrogate Key
✅ Creation of Bridge/Fact-Less Fact Table
✅ Creation of Calculated Tables
✅ Building Calendar Table
Unit 9: Data Visualization
✅ Many to Many Relationship
✅ Applying Security Filters in Both Directions
✅ Working with Views and Perspectives
✅ Composite Model
✅ Writing Properties for Tool Tip
✅ Creating Hierarchies
Unit 10: DAX Introduction and Core Concepts
✅ Understanding DAX Rules and Concepts
✅ Filter Context
✅ Row Context
✅ Calculated Columns
✅ Calculated Measures
✅ Calculated Tables
Unit 11 : Common DAX Functions
✅ Related/Related Table function.
✅ Sum function
✅ Count Function
✅ SumX function
✅ Calculate function.
✅ Filter Function
✅ Userelationship function
✅ Using Variables for DAX
Unit 12 : Quick Measures
✅ Introduction to Quick Measures
✅ Quick Measure – Year to Date
✅ Quick Measure – Filter
✅ Quick Measure – Rolling Average
✅ Quick Measure – Percentage Difference
Unit 13: Data Visualization
✅ Drilling through Filters across Reports
✅ Creating KPI Score Card
✅ Working With Uni Char Symbols
✅ Slicer Synchronization across Multiple Pages
✅ Working With the Selection and Bookmarks Pane
✅ Q&A Improvements
✅ Creating infographics
Unit 14 : Conditional Formatting in Power BI
✅ By Background Color
✅ By Font Color
✅ Data Bar
✅ By Rule
✅ By Another Column
✅ Dynamic Chart Titles
✅ Switch DAX Function
✅ For Chart Visuals using Measures
Unit 15: AI Enhanced Visualization
✅ What are AI visuals?
✅ Key Influencer Visual
✅ Clustering using Scatter Chart
Unit 16: Performance Analyzer
✅ What is Performance Analyzer?
✅ Start Recording
✅ Understanding the Results
✅ Drilling Down into the Visual
✅ Renaming the visual using Selection Pane
✅ Analyze Results to Modify Slicer
✅ Analyze Results to Refresh a Particular Visual
Unit 17: Working with Row Level Security
✅ Creating Roles
✅ Writing Table Filter Expressions for a Single Field
✅ Writing Table Filter Expressions for Multiple Fields
✅ Viewing as Roles
✅ Creating Dynamic Row Level Security
✅ Creating Dynamic Row Level Security According to Reporting Line
✅ Assigning Members to Roles
✅ URL Filtering
✅ Dynamic URL Filtering
Unit 18: Work Space App
✅ Testing Scenarios in Power Bi Service
✅ Creating Workspace Apps
✅ Assigning Permissions in Workspace Apps
✅ Collaborating on Shared Reports
✅ Sharing Reports Using Apps
Unit 19: Working with Parameters and Functions
✅ Create a New Parameter
✅ Importing web query using parameter
✅ Creating functions
✅ Invoking functions
✅ Defining a list
✅ Converting List to Table
✅ Adding Column by invoking custom functions
#1 Choice For Power BI Training